Orca Position Simulator
The Position Simulator in Orca's pools UI shows a liquidity provider their PnL across a price range before they deposit. I built it as a freelancer.
- Role
- Built the Position Simulator in Orca's pools UI
- When
- 2022–2023
- Client
- Orca, freelance
- Stack
- React, TypeScript, Solana, CLMM math, Data visualization
- Status
- Live ↗
Context
Orca is one of the largest decentralized exchanges on Solana. Its pools use concentrated liquidity, so a liquidity provider doesn't spread a deposit across every possible price. They choose a price range, and their capital only earns while the price stays inside it.
That makes a deposit much more capital-efficient, and much harder to reason about. What a position earns depends on where the range sits, how long the price stays in it, the fees collected while it does, and the impermanent loss compared with just holding the two tokens. Without a tool for it, a liquidity provider deposits first and finds out how those pieces add up later.
What I built
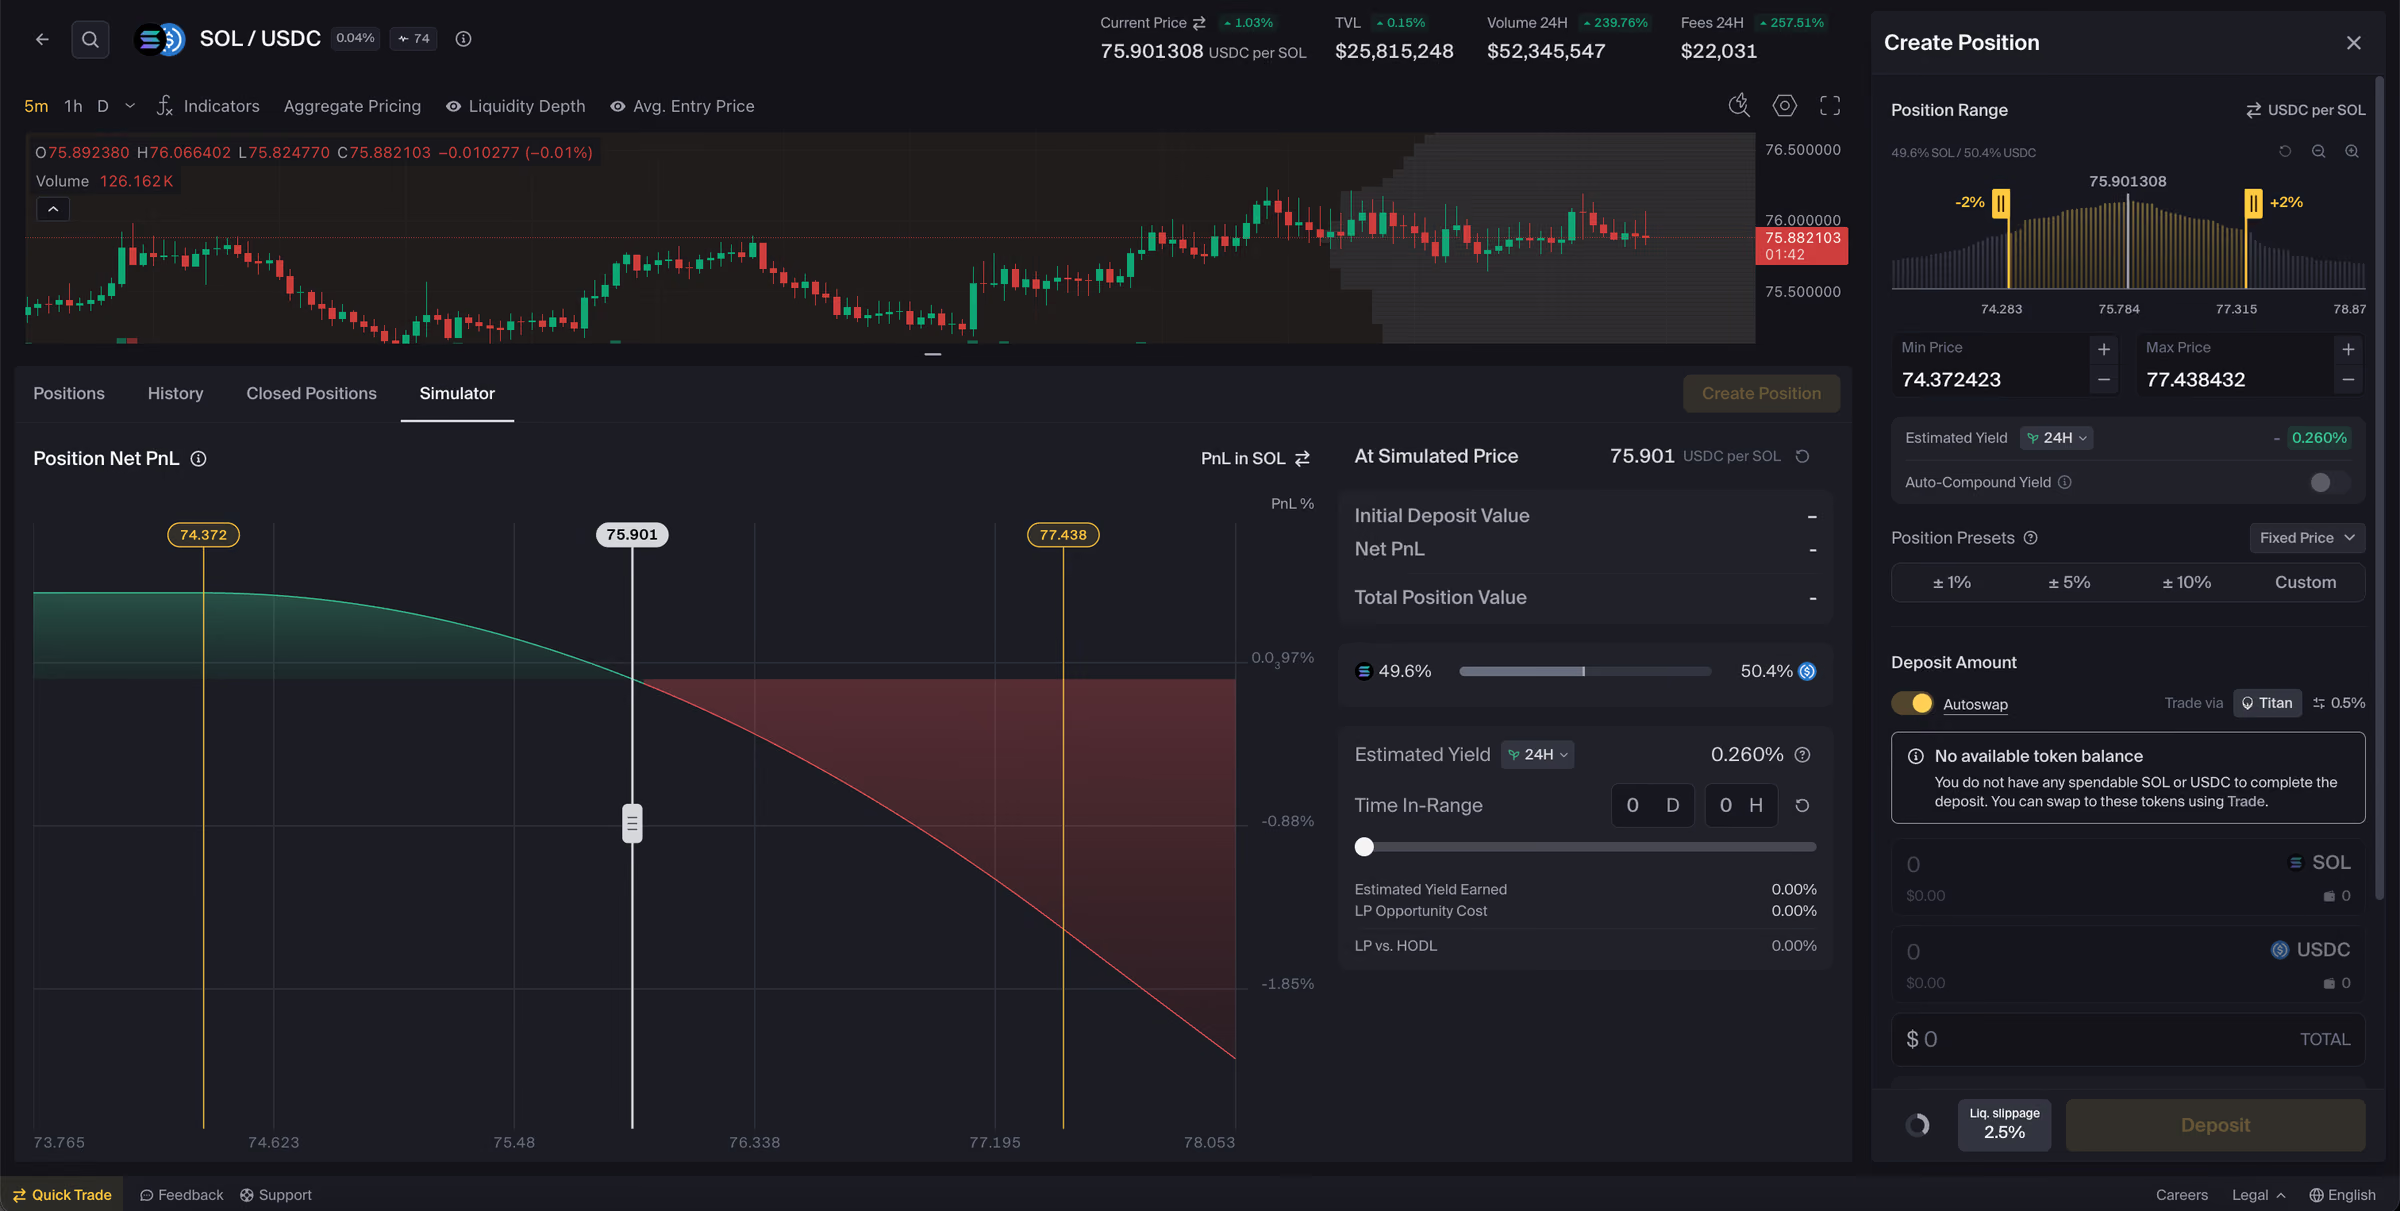
The simulator sits under the chart on a pool's page, in its own tab next to the positions and history tabs.
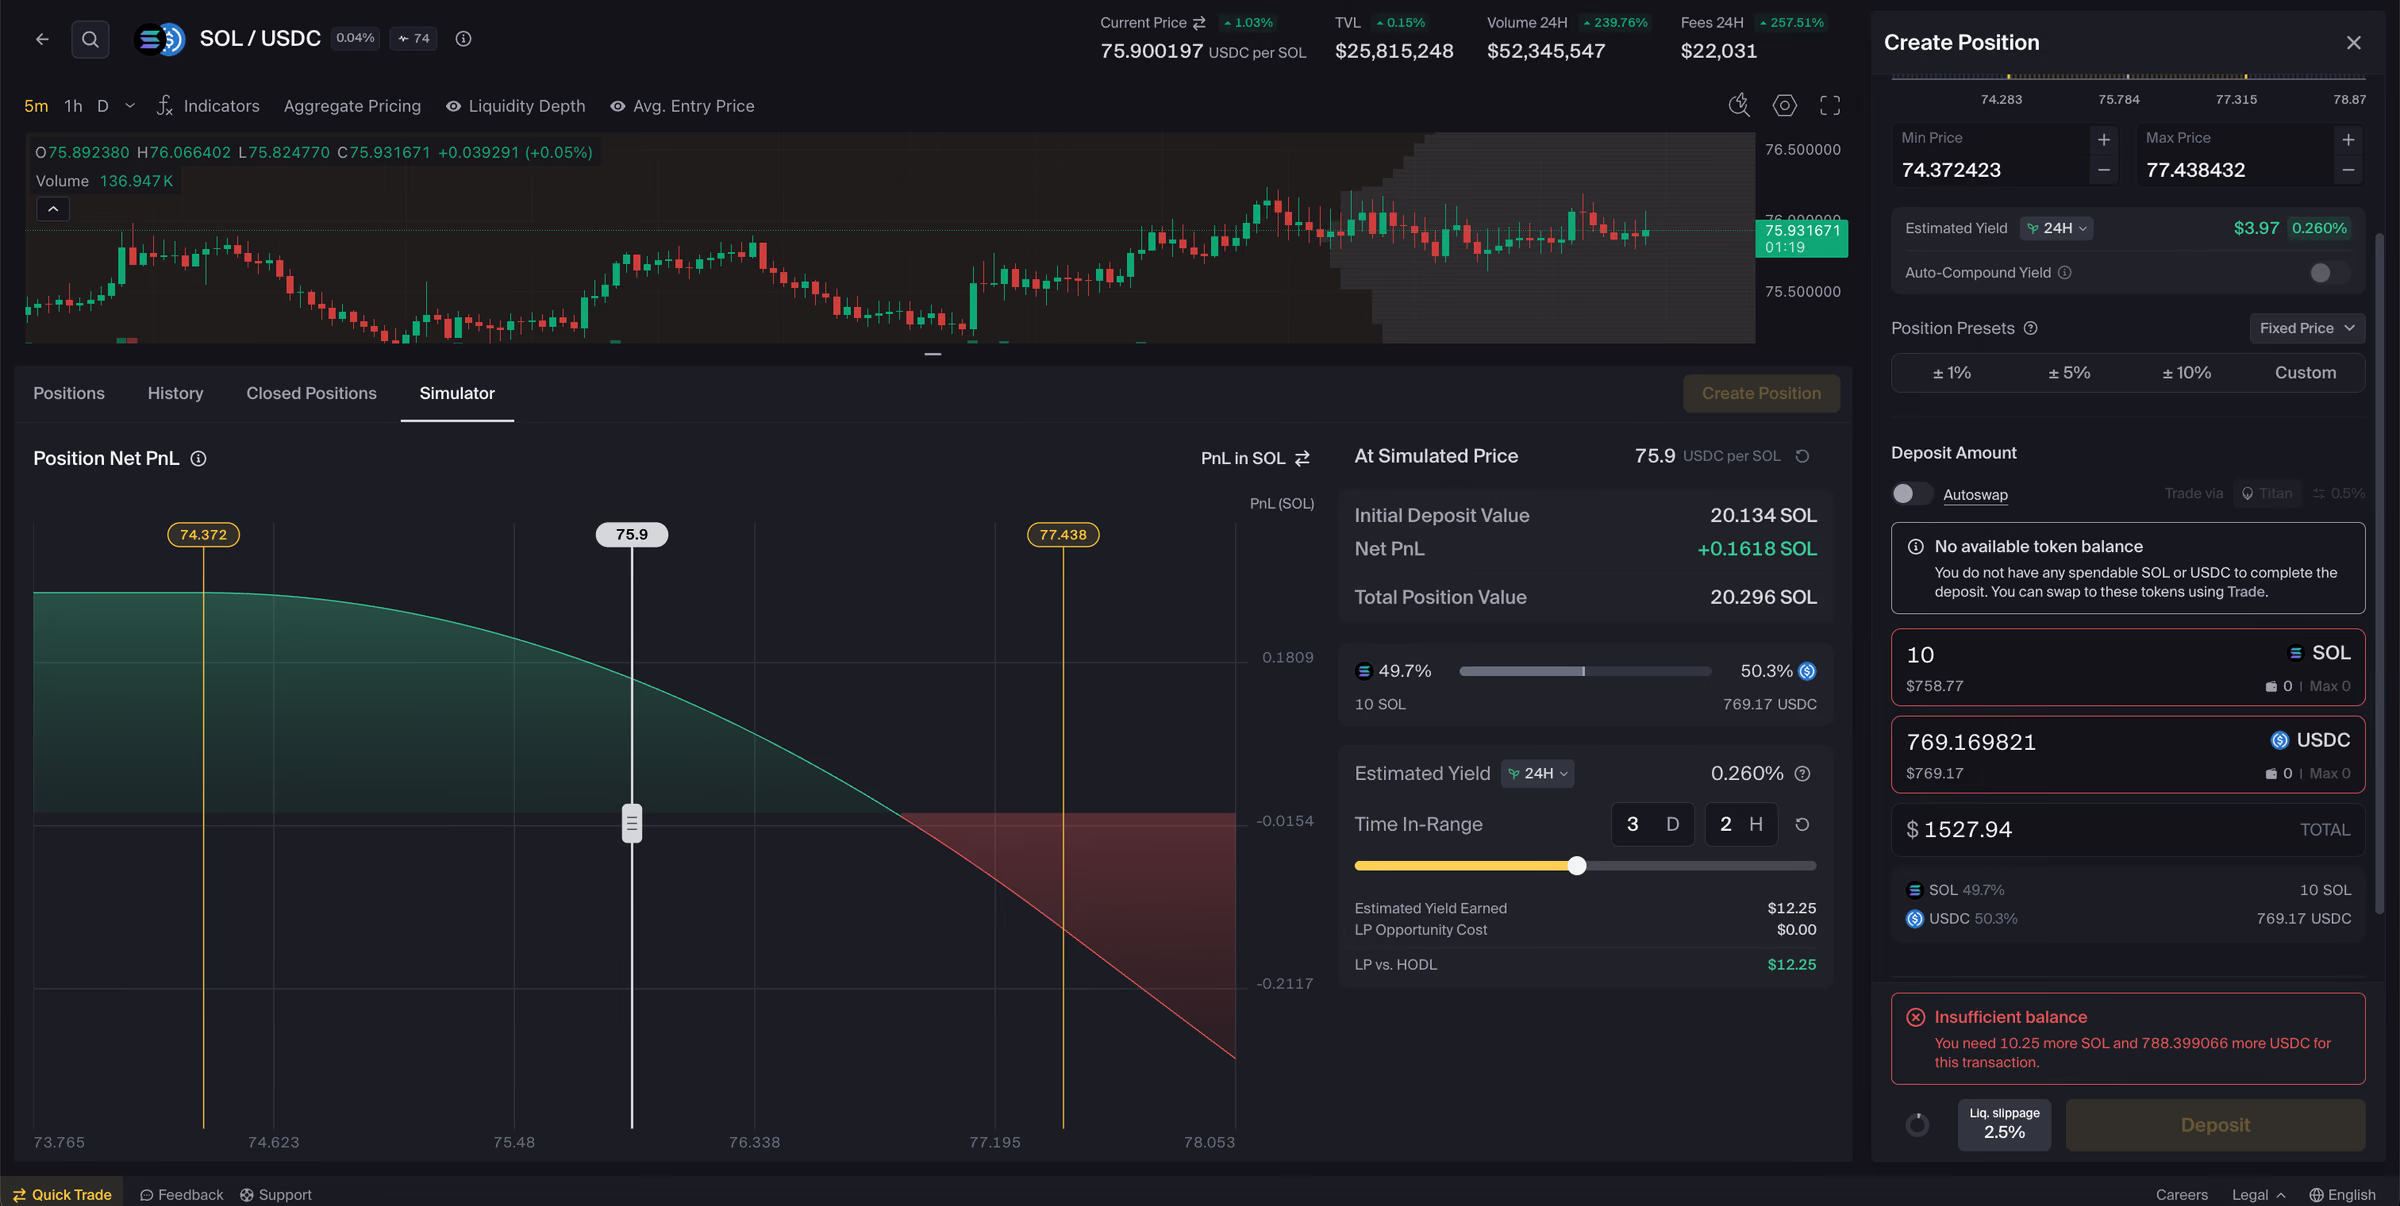
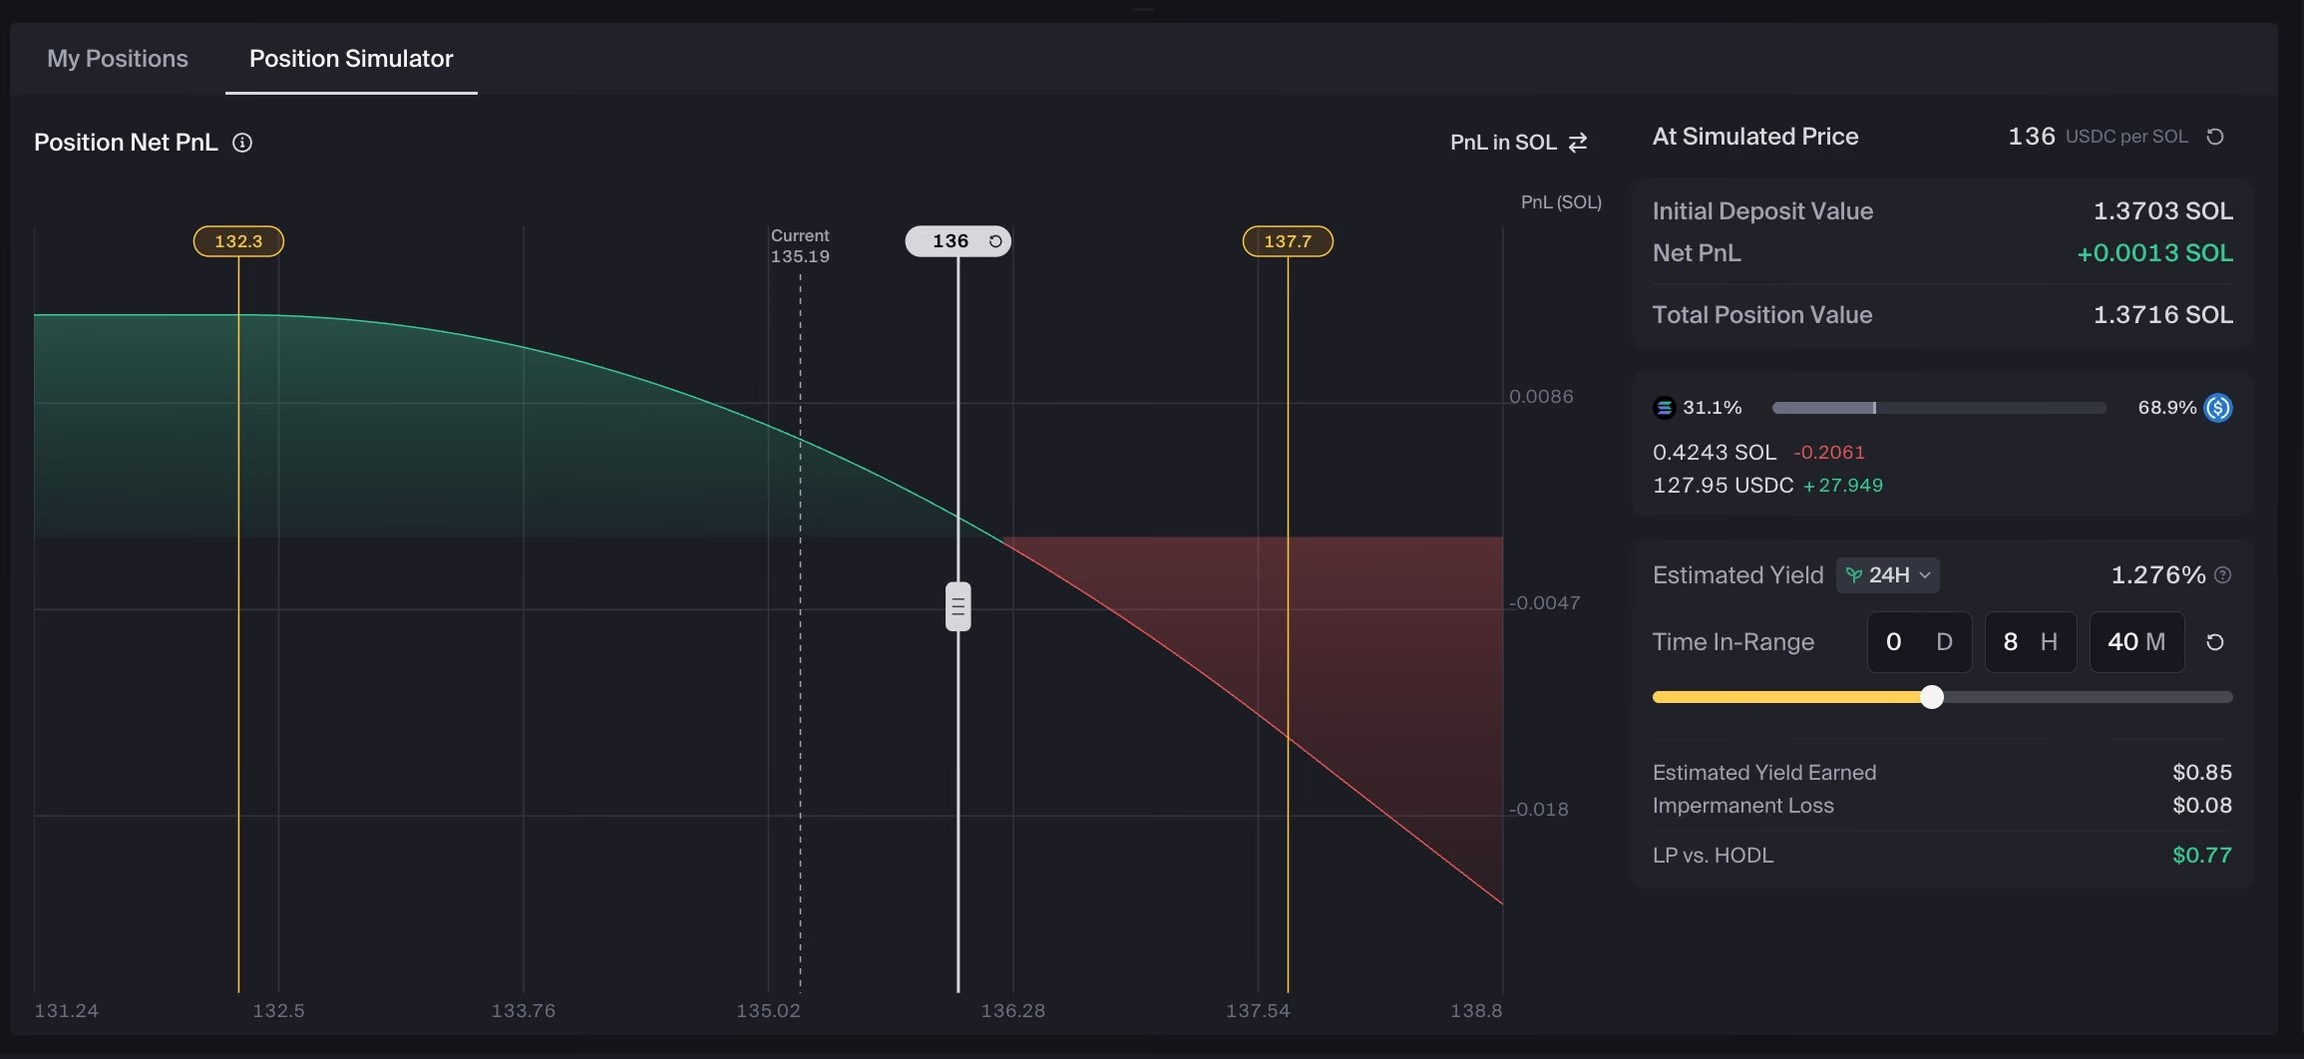
It plots a Net PnL curve across the chosen range, with gains and losses in different colors and a price marker you can drag along it. At the simulated price it shows:
- the initial deposit value, net PnL and total position value
- the split between the pool's two tokens
- estimated yield over a chosen timeframe, and time in range
- yield earned, impermanent loss and LP opportunity cost
- LP vs HODL, which is whether providing liquidity beat just holding the tokens
It follows the range and deposit set in the Create Position panel, and you don't need to connect a wallet.
How it works
- You choose a range and a deposit in the Create Position panel.
- The simulator takes that range and deposit and the pool's current price.
- It draws Net PnL across the range, and a price marker you can drag.
- At the marker's price it computes the deposit value, token mix, position value and impermanent loss.
- With a timeframe and a time-in-range estimate, it adds estimated yield and compares the position with holding.
The math
A concentrated-liquidity position is defined by its liquidity and two price bounds. Inside the range, the amount of each token follows from the square root of the price. Below the range the position is entirely the first token, and above it, entirely the second. Net PnL, token mix and impermanent loss all come out of those relationships, evaluated at the simulated price and compared with the value of the original deposit.
The Range demo
The demo on this site is my own re-creation, not Orca's code. It's a small concentrated-liquidity module in TypeScript, and I test it against Orca's open-source Whirlpools quote functions on the same inputs, to a tight relative tolerance.
It plays a position against real daily SOL/USDC prices from CoinGecko, April to September 2026, saved in the repo with the source and the date they were fetched. Because it doesn't fetch prices live, it loads straight away and keeps working when the price API is down. Like the real simulator, it needs no wallet. You can try the Range demo.
Position PnL across a price range
Set a deposit and a price range, then move the ending price.
If you deposited between and , and SOL ended at after …
you’d hold $959.87: +$169.37 on the deposit, −$146.29 against simply holding. In range 165 of 180 days.
- Deposit
- $790.49at $79.05: 7.887 SOL + 166.99 USDC
- Position value
- $959.87+$169.37 (+21.43%)
- Versus holding
- −$146.29−13.22% impermanent loss
- Ending mix
- 1.254 SOL+ 810.58 USDC; price inside your range
Fees and rewards aren’t modeled, so this only shows the part of PnL that comes from the price and your range. The path is SOL’s real daily price over the last 180 days, tilted smoothly to finish at your ending price. Price data: CoinGecko, 2026-04-03 to 2026-09-29 (USDC taken as $1), fetched 2026-09-29.
This is my own re-creation of the math, not Orca’s code.
Screenshots
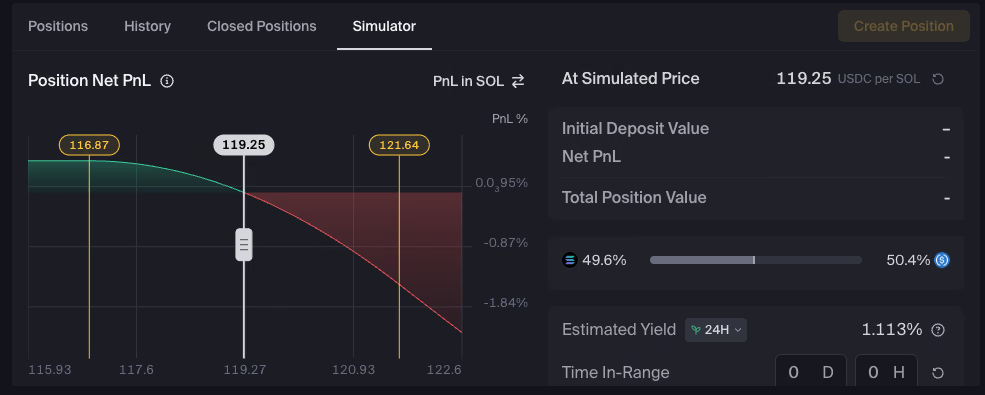
Position Simulator as live on orca.so, Sept 2026.
My part
The screenshots are from orca.so in August and September 2026, so the simulator may have changed since I built it in 2022–23.
Links
Stack: React, TypeScript, Solana, CLMM math, Data visualization